Search This Blog

Saturday, September 9, 2017

Service mesh examples of Istio and Linkerd using Spring Boot and Kubernetes

Introduction

When working with Microservice Architectures, one has to deal with concerns like Service Registration and Discovery, Resilience, Invocation Retries, Dynamic Request Routing and Observability.  Netflix pioneered a lot of frameworks like EurekaRibbon and Hystrix  that enabled Microservices to function at scale addressing the mentioned concerns. Below is an example communication between two services written in Spring Boot that utilizes Netflix Hystrix and other components for resiliency, observability, service discovery, load balancing and other concerns.


While the above architecture does solve some problems around resiliency and observability it still is not ideal:

a.  The solution does not apply for a Polyglot service environment as the libraries mentioned are catering to a Java stack.  For example, one would need to find/build libraries for Node.js to participate in service discovery and support observability.

b. The service is burdened with  'communication specific concerns' that it really should not have to deal with like service registration/discovery, client side load balancing, network retries and resiliency.

c. It introduces a tight coupling with the said technologies around resiliency, load balancing, discovery etc making it very difficult to change in the future.

d.  Due to the many dependencies in the libraries like Ribbon, Eureka and Hystrix, there is an invasion of your application stack. If interested, I discussed this in my BLOG around: Shared Service Clients

Sidecar Proxy

Instead of the above, what if you could do the following where a Side Car is introduced that takes on all the responsibilities around Resiliency, Registration, Discovery, Load Balancing, Reporting client metrics and Telemetry etc?:

The benefit of the above architecture is that it facilitates the existence of a Polyglot Service environment with low friction as a majority of the concerns around networking between services are abstracted away to a side car thus allowing the service to focus on business functionality. Lyft Envoy is a great example of a Side car Proxy (or Layer 7 Proxy) that provides resiliency and observability to a Microservice Architecture.

Service Mesh

"A service mesh is a dedicated infrastructure layer for handling service-to-service communication. It’s responsible for the reliable delivery of requests through the complex topology of services that comprise a modern, cloud native application. In practice, the service mesh is typically implemented as an array of lightweight network proxies that are deployed alongside application code, without the application needing to be aware. (But there are variations to this idea, as we’ll see.)"  - Buoyant.io

In a Microservice Architecture deployed on a Cloud Native Model, one would deal with 100s of services each running multiple instances of them with instances being created and destroyed by the orchestrator. Having the common cross cutting functionalities like Circuit Breaking, Dynamic routing, Service Discovery, Distributed Tracing, Telemetry being managed by an abstracted into a Fabric with which services communicate appears the way forward.

Istio and Linkerd are two Service meshes that I have played with and will share a bit about them.

Linkerd


Linkerd is an open source service mesh by Buoyant developed primarily using Finagle and netty. It can run on Kubernetes, DC/OS and also a simple set of machines.

Linkerd service mesh, offers a number of features like:
  • Load Balancing
  • Circuit Breaking
  • Retries and Deadlines
  • Request Routing
It instruments top line service metrics like Request Volume, Success Rates and Latency Distribution. With its Dynamic Request Routing, it enables Staging Services, Canaries, Blue Green Deploys with minimal configuration with a powerful language called DTABs.
There are a few ways that Linkerd can be deployed in Kubernetes. This blog will focus on how Linkerd is deployed as a Kubernetes Daemon Set, running a pod on each node of the cluster. 


Istio


Istio (Greek for Sail) is an open platform sponsored by IBM, Google and Lyft that provides a uniform way to connect, secure, manage and monitor Microservices. It supports Traffic Shaping between micro services while providing rich telemetry.

Of note:
  • Fine grained control of traffic behavior with routing rules, retires, failover and fault injection
  • Access Control, Rate Limits and Quota provisioning
  • Metrics and Telemetry
At this point, Istio currently supports only Kubernetes but their goal in the future is to support additional platforms as well. An Istio service mesh can be considered of logically consisting of:
  • A Data Plane of Envoy Sidecars that mediate all traffic between services
  • A Control Plane whose purpose is to manage and configure proxies to route and enforce traffic policies.

Product-Gateway Example

The Product Gateway that I have used in many previous posts is used here as well to demonstrate Service Mesh. The one major difference is that the service uses GRPC instead of REST.  From a protocol perspective a HTTP 1.X REST call is made to /product/{id} of the Product gateway service. The Product Gateway service then fans to  base product, inventory, price and reviews using GRPC to obtain the different data points that represents the end Product. Proto schema elements from the individual services are used to compose the resulting Product proto. The gateway example is used for the Linkerd and Isitio examples. The project provided does not explore all the features of the service mesh but instead gives you enough of an example to try Istio and Linkerd with GRPC services using Spring Boot.

The code for this example is available at: https://github.com/sanjayvacharya/sleeplessinslc/tree/master/product-gateway-service-mesh

You can import the project into your favorite IDE's and run each of the Spring Boot services. Invoking http://localhost:9999/product/931030.html.will call the Product gateway which will then invoke the other service using GRPC to finally return back a minimalistic product page.

For running the project on Kubernetes, I had installed Minikube on my Mac.  Ensure that you can dedicate sufficient memory to your Minikube instance. I did not set up a local Docker registry but chose to use my local docker images.  Stack Overflow has a good posting on how to use local docker images.  In the Kubernetes deployment descriptors, you will notice that for the product gateway images, the settings for imagePullPolicy are set to Never.  Before you proceed, to be able to use the Docker Daemon, ensure that you have executed:

>eval $(minikube docker-env)

Install the Docker images for the different services of the project by executing the below from the root folder of the project:
>mvn install

Linkerd


In the sub-folder titled linkerd there are a few yaml files that are available.  The linkerd-config.yaml will set up linkerd and define the routing rules:
>kubctl apply -f ./linkerd-config.yaml

Once the above is completed you can access the Linkerd Admin application by doing the following:
>ADMIN_PORT=$(kubectl get svc l5d -o jsonpath='{.spec.ports[?(@.name=="admin")].nodePort}')
>open http://$(minikube ip):$ADMIN_PORT

The next step is to install the different product gateway services. The Kubernetes definitions for these services are present in the product-linkerd-grpc.yaml file.
>kubectl apply -f ./product-linkerd-grpc.yaml

Wait for a bit for Kubernetes to spin up the different pods and services. You should be able to execute 'kubectl get svc' and see something like the below showing the different services up:

We can now execute a call on the product-gateway and see it invoke the other services via the service mesh. Execute the following:

>HOST_IP=$(kubectl get po -l app=l5d -o jsonpath="{.items[0].status.hostIP}")
>INGRESS_LB=$HOST_IP:$(kubectl get svc l5d -o 'jsonpath={.spec.ports[2].nodePort}')
>http_proxy=$INGRESS_LB curl -s http://product-gateway/product/9310301

The above is also demonstrating linkerd as a HTTP proxy. With the http_proxy set, curl sends the proxy request to linkerd which will then lookup product-gateway via service discovery and route the request to an instance.
The above call should result in a JSON representation of the Product as shown below:
{"productId":9310301,"description":"Brio Milano Men's Blue and Grey Plaid Button-down Fashion Shirt","imageUrl":"http://ak1.ostkcdn.com/images/products/9310301/Brio-Milano-Mens-Blue-GrayWhite-Black-Plaid-Button-Down-Fashion-Shirt-6ace5a36-0663-4ec6-9f7d-b6cb4e0065ba_600.jpg","options":[{"productId":1,"optionDescription":"Large","inventory":20,"price":39.99},{"productId":2,"optionDescription":"Medium","inventory":32,"price":32.99},{"productId":3,"optionDescription":"Small","inventory":41,"price":39.99},{"productId":4,"optionDescription":"XLarge","inventory":0,"price":39.99}],"reviews":["Very Beautiful","My husband loved it","This color is horrible for a work place"],"price":38.99,"inventory":93}
You can subsequently install linkerd-viz, a monitoring application based of Prometheus and Grafana that will provide metrics from Linkerd. There are three main categories of metrics that are visible on the dashboard, namely, Top Line (Cluster Wide success rate and request volume), Service Metrics (A section for each service deployed on success rate, request volume and latency) and Per-instance metrics (Success rate, request volume and latency for every node in the cluster).
>kubectl apply -f ./linkerd-viz.yaml
Wait for a bit for the pods to come up and then you can view the Dashboard by executing:
>open http://$HOST_IP:$(kubectl get svc linkerd-viz -o jsonpath='{.spec.ports[0].nodePort}')

The dashboard will show you metrics around Top line service metrics and also metrics around individual monitored services as shown in the screen shots below:


You could also go ahead and install linkerd-zipkin to capture tracing data.

Istio


The Istio page on installation is pretty thorough. There are a few options you are presented with for installation on the installation page. You should select which ones make sense for your deployment. For my demonstration case, I selected the following
>kubectl apply -f $ISTIO_HOME/install/kubernetes/istio-rbac-beta.yaml
>kubectl apply -f $ISTIO_HOME/install/kubernetes/istio.yaml

You can install metrics support by installing Prometheus, Grafana and Service Graph.
>kubectl apply -f $ISTIO_HOME/install/kubernetes/addons/prometheus.yaml
>kubectl apply -f $ISTIO_HOME/install/kubernetes/addons/grafana.yaml
>kubectl apply -f $ISTIO_HOME/install/kubernetes/addons/servicegraph.yaml

Install the product-gateway artifacts using the below command which uses istioctl kube-inject to automatically inject Envoy Containers in the different pods:
>kubectl apply -f <(istioctl kube-inject -f product-grpc-istio.yaml)

>export GATEWAY_URL=$(kubectl get po -l istio=ingress -o 'jsonpath={.items[0].status.hostIP}'):$(kubectl get svc istio-ingress -o 'jsonpath={.spec.ports[0].nodePort}')

If your configuration is deployed correctly, it should resemble something like the below:

You can now view a HTML version of the product by going to http://${GATEWAY_URL}/product/931030.html to see a primitive product page or access a JSON representation by going to http://${GATEWAY_URL}/product/931030

Ensure you have set the ServiceGraph and Grafana port-forwarding set as described in the Installation instructions and also shown below:

>kubectl port-forward $(kubectl get pod -l app=grafana -o jsonpath='{.items[0].metadata.name}') 3000:3000 &
>kubectl port-forward $(kubectl get pod -l app=servicegraph -o jsonpath='{.items[0].metadata.name}') 8088:8088 &

To see the service graph and Istio Viz dashboard, you might want to send some traffic to the service.

>for i in {1..1000}; do echo -n .; curl -s http://${GATEWAY_URL}/product/9310301 > /dev/null; done

You should be able to access the Istio-Viz dashboard for Topline and detailed service metrics like shown below at http://localhost:3000/dashboard/db/istio-dashboard:


Similarly you can access the Service graph via at the address: http://localhost:8088/dotviz to see a graph similar to the one shown below depicting service interaction:

Conclusion & Resources


A service mesh architecture appears the way forward for Cloud Native deployments. The benefits provided by the mesh does not need any re-iteration.  Linkerd is more mature when compared to Istio but Istio although newer, has the strong backing of IBM, Google and Lyft to take it foward.  How do they compare with each other? The  BLOG post by Abhishek Tiwari comparing Linkerd and Istio features is a great read on the topic of service mesh and comparisons. Alex Leong has a nice youtube presentation on Linkerd that is a good watch. Kelsey Hightower has a nice example driven presentation on Istio

Wednesday, August 16, 2017

SpringBoot Microservice Example using Docker,Kubernetes and fabric8

Introduction

Kubernetes is container orchestration and scaling system from google. It provides you the ability to deploy, scale and manage container based applications and provides mechanism such as service discovery, resource sizing, self healing etc. fabric8 is a platform for creating, deploying and scaling Microservices based of Kubernetes and Docker. As with all frameworks nowadays, it follows an 'opinionated' view around how it does these things. The platform also has support for Java Based (Spring Boot) micro services. OpenShift, the Hosted Container Platform by RedHat is based of fabric8. fabric8 promotes the concept of Micro 'Service teams' and independent CI/CD pipelines if required by providing Microservice supporting tools like Logging, Monitoring and Alerting as readily integrateable services.
From Gogs (git), Jenkins (build/CI/CD pipeline) to ELK (Logging)/Graphana(Monitoring) you get them all as add ons. There are many other add-ons that are available apart from the ones mentioned.

There is a very nice presentation on youtube around creating a Service using fabric8. This post looks at providing a similar tutorial by using the product-gateway example I had shared in a previous blog.

SetUp

For the sake of this example, I used Minikube version v0.20.0. and as my demo was done on a Mac, I used the xhyve driver as I found it the most resource friendly of the options available. The fabric8 version used was: 0.4.133. I first installed and started Minikube and ensured that everything was functional by issuing the following commands:
>minkube status
minikube: Running
localkube: Running
kubectl: Correctly Configured: pointing to minikube-vm at 192.168.64.19
I then proceeded to install fabric8 by installing gofabric8. If for whatever reason the latest version of fabric8 does not work for you, you can try to install the version I used by going to the releases site. Start fabric8 by issuing the command
>gofabric8 start
The above will result in the downloading of a number of package and then result in the launching of the fabric8 console. Be patient as this takes some time. You could issue the following command on a different window to see the status of fabric8 set up:
>kubectl get pods -w
NAME                                      READY     STATUS    RESTARTS   AGE
configmapcontroller-4273343753-2g03x      1/1       Running   2          6d
exposecontroller-2031404732-lz7xs         1/1       Running   2          6d
fabric8-3873669821-7gftx                  2/2       Running   3          6d
fabric8-docker-registry-125311296-pm0hq   1/1       Running   1          6d
fabric8-forge-1088523184-3f5v4            1/1       Running   1          6d
gogs-1594149129-wgsh3                     1/1       Running   1          6d
jenkins-56914896-x9t58                    1/1       Running   2          6d
nexus-2230784709-ccrdx                    1/1       Running   2          6d
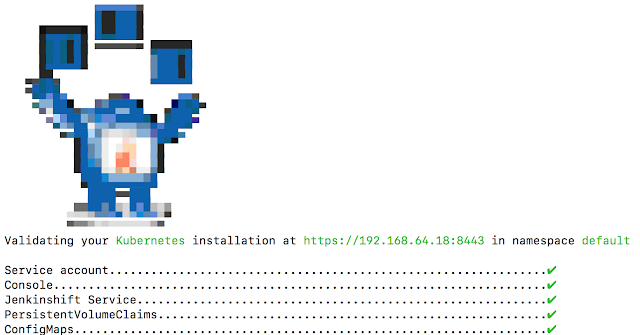
Once fabric8 has started successfully, you can also issue a command to validate fabric8 by issuing:
>gofabric8 validate
If all is good you should see something like the below:
Also note that if your fabric8 console did not launch, you could also launch it by issuing the following command which will result the console being opened in a new window:
>gofabric8 console

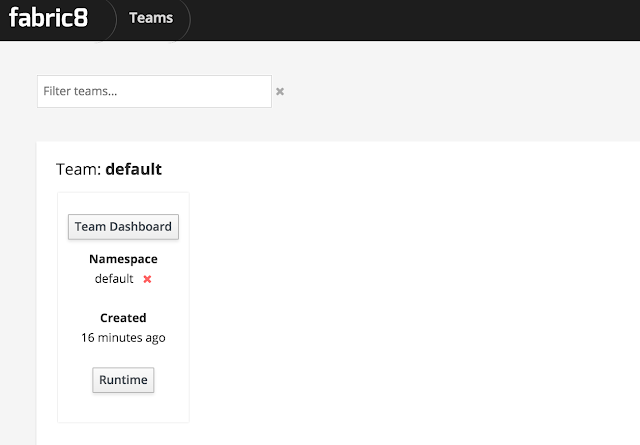
At this point, you should be presented with a view of the default team:

Creating a fabric8 Microservice

There are a few ways you can generate a fabric8 micro service using Spring Boot. The fabric8 console has an option to generate a project that pretty much does what Spring Initializer does. Following that wizard will take you to through completion of your service. In my case, I was porting existing product-gateway example over so I followed a slightly different route. I did the following for each of the services:

Setup Pom


Run the following command on the base of your project:
>mvn io.fabric8:fabric8-maven-plugin:3.5.19:setup
This will result in your pom being augmented with fabric8 plugin (f8-m-p). The plugin itself is primarily focussed on Building Docker images and creating Kubernetes resource descriptors. If you are simply using the provided product-gateway as an example, you don't need to run the setup step as it has been pre-configured with the necessary plugin.

Import Project


From the root level of your project, issue the following:
>mvn fabric8:import
You will be asked for the git user name and password. You can provide gogsadmin/RedHat$1. Your project should now be imported into fabric8. You can access the Gogs(git) repository from the fabric8 console or by issuing the following on the command line:
>gofabric8 service gogs
You can login using the same credentials mentioned above and see that your project has been imported into git.

Configuring your Build


At this point on the fabric8 console if you click on Team Dashboard, you should see your project listed.
Click on the hyperlink showing the project to open the tab where you are asked to configure secrets.
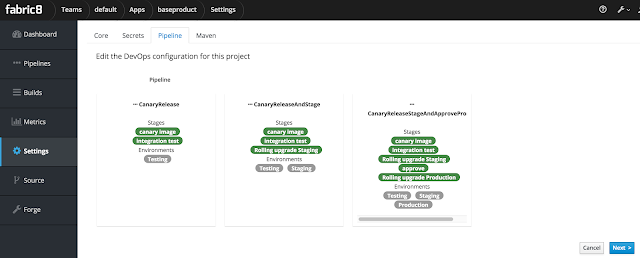
For the scope of this example select the default-gogs-git and click Save Selection on the top right. You will then be presented with a page that allows you to select the build pipeline for this project. Wait for a bit for this page to load.

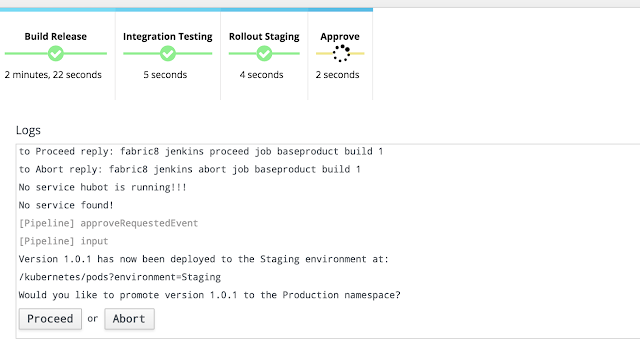
Select the last option with Canary test and click Next. The build should kick off and during the build process, you should be prompted to approve the next step to goto production, something like the below:

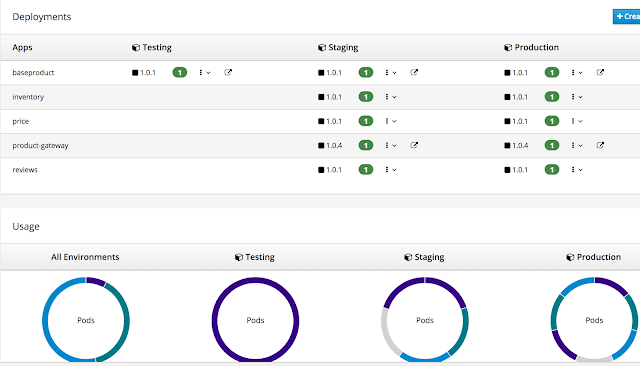
Once you select 'Proceed' your build will move to production. At this point what you have is a project out in production ready to received traffic. Once you import all the applications in the product-gateway example, you should a view like the below showing the deployments across environments:


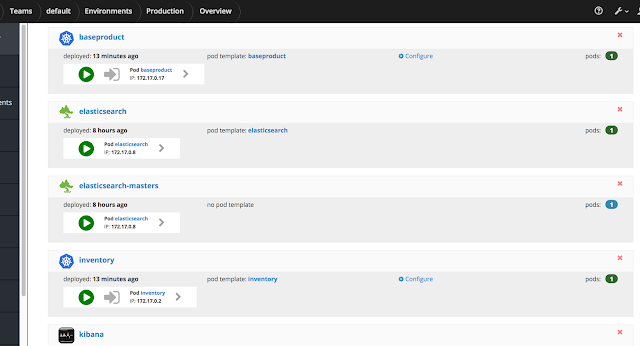
Your production environment should look something like the below showing your application and other supporting applications:


If your product-gateway application is deployed successfully, you should be able to open it up and access the product resource of the one product that the application supports at :
http://192.168.64.19:31067/product/9310301 The above call will result in the invoking of the base product, reviews, inventory and pricing services to provide a combined view of the product.
So how is the product-gateway discovering the base product and other services to invoke?
Kubernetes provides for service discovery natively using DNS or via Environment variables. For the sake of this example I used Enviroment variables but there is no reason you could not use the former. The following is the code snippet of the product-gateway showing the different configurations being injected:
@RestController
public class ProductResource {
  @Value("${BASEPRODUCT_SERVICE_HOST:localhost}")
  private String baseProductServiceHost;
  @Value("${BASEPRODUCT_SERVICE_PORT:9090}")
  private int baseProductServicePort;

  @Value("${INVENTORY_SERVICE_HOST:localhost}")
  private String inventoryServiceHost;
  @Value("${INVENTORY_SERVICE_PORT:9091}")
  private String inventoryServicePort;

  @Value("${PRICE_SERVICE_HOST:localhost}")
  private String priceServiceHost;
  @Value("${PRICE_SERVICE_PORT:9094}")
  private String priceServicePort;

  @Value("${REVIEWS_SERVICE_HOST:localhost}")
  private String reviewsServiceHost;
  @Value("${REVIEWS_SERVICE_PORT:9093}")
  private String reviewsServicePort;

  @RequestMapping(value = "/product/{id}", method = RequestMethod.GET, produces = MediaType.APPLICATION_JSON_VALUE)
  @ResponseBody
  .....
}
At this point what you have is a working pipe line. What about Logging, Monitoring etc etc. These are available for you as add-ons to your environment. For Logging, I went ahead and installed the Logging Template that put fluentd + ELK stack for searching through logs.  You should then be able to search for events through Kibana.

Conclusion

The example should have given you an good start into of how dev pipe-lines could work with Kubernetes and containers and how fabric8's opinionated approach facilitates the same. The ability to push out immutable architectures using a Dev Ops pipeline like fabric8 is great for a team developing Microservices with Service Teams. I ran this on my laptop and must admit, it was not always smooth sailing. Seeing the forums around fabric8, the folk seem to be really responsive to the different issues surfaced. The documentation is quite extensive around the product as well. Kudos to the team behind it. I wish I had the time to install Chaos Monkey and the Chat support to see those Add-In's in action. I am also interested in understanding what Openshift software adds on top of fabric8 for their managed solution.. The code backing this example is available to clone from git hub.

Friday, August 11, 2017

Shared Client Libraries - A Microservices Anti-Pattern, a study into why?

Introduction


As I continue my adventures with demystifying Microservices for myself, I keep hearing of this anti-pattern, 'Shared Service Client' or 'Shared Binary Client' or even 'Client Library'. Sam Newman in his book about Microservices says, "I've spoken to more than one team who has insisted that creating libraries for your services is an essential part of creating services in the first place". I must admit that I have seen and implemented this pattern right through my career. The driver for generating a client has been DRY (Don't repeat yourself).  The creation of Service Clients and making them available for consumption by other applications and services is a prevalent pattern. An example is shown below where a shareable Notes-client is created by a Team as part of the project for the Notes Web Service. They might also provide a DTO (Data Transfer Object) library representing exchanged payload.

This BLOG is my investigation into why this concept of a Service Client or a Client library causes heart burn to Microservice advocates.

Service Clients over time


Feel free to skip this section totally, it's primarily me reminiscing.

In my university days, when we used to work on network assignments, the interaction between a server and client would primarily involve creating a Socket, connecting to the server and sending/receiving data. There really was no explicit contract that someone wishing to communicate with the server could use to generate a client. The remote invocation however was portable across language/platform. Any client that can open a socket could invoke the server method.

I subsequently worked with Java and RMI. One would take a stub, then generate client and server code from it. Callers higher in the stack would invoke 'methods' using the client which would then run across the wire and be invoked on the server. From a client's perspective, it was as if the call was happening in the local JVM. Magical! A contract of sorts was established. Heterogeneous clients did not really have a place in this universe unless you got dirty with JNI. Another model existed at roughly the same time with CORBA and ORBs. The IDL or Interface Definition Language served to provide a contract by which client and server could be generated for a language and platform that could generate corresponding code from the IDL. Heterogeneous Clients could thrive in this ecosystem. Later down the chain came WS*, SOAP, Axis, Auto WSDL to Whatever generation tools like RAD (Rational Application Developer) that created a Client for a SOAP service.I had used a tool called Rational Application Developer which was a 4 C/D install which would fail often but when it worked, you could click on a WSDL and see it generate these magical code snippets for the client.

The WS* bubble was followed by the emergence of an Architecture style known as REST and its poster child, HTTP. Multiple representation types were a major selling point. To define Resources and their supported operations, there was WADL. Think of WADL as a poor cousin of WSDL that even the W3C preferred to not standardize. REST like it not, many a time is used for making remote procedure calls than walking a Hypermedia graph via Links as prescribed by Richardson Maturity model and HATEOS. Many developers of a REST service create a Client library that communicates via HTTP to the REST resources and due to the simplicity of REST, writing the client code was not arduous and did not require generation tools. REST itself was a contract. WADL if you want to stretch it and HATEOS if you want to argue about it made their ways to provide something like an IDL. Heterogeneous clients thrived with REST. The point to note is IDL seems to have taken a back seat here. Enter GRPC, a high performance open source framework from google. Has an IDL via .proto files. Supports Heterogeneous/Polyglot clients. It's just fascinating how IDL's are here to stay.

Reasons why Service Clients get a bad name


To facilitate the discussion of Service Clients and why they do not work, consider the following Customer Service Application written in Java that uses Service clients for Notes, Order management, Product Search and Credit Card. These Clients are provided by individual service maintainers.

The Not-So-Thin Service Client or The Very "Opinionated Client"


Service Clients many times start serving a higher purpose than what they were originally designed for. Consider for example the following hypothetical Notes Client:


The Notes Client seems to do a lot of things:
  • Determining strategy around whether to call the Notes Service or fall back to the Database
  • Determining whether to invoke calls in parallel or serial
  • Providing a Request Cache and caching data
  • Translating the response from the service into something the client will understand and absorb
  • Providing functionality to Audit note creation (stretching here:-))
  • Providing Configuration defaults around Connection pools, Read Timeouts and other client properties
The argument is "Who but the service owner knows best how to interact with the service and the controls to provide?". There are a few things with this design that are happening:
  • It does not account for non-Java clients
  • Bundles in a bunch of logic into the client around Notes (yes stretching it here with a Notes example :-))
  • Imposes a Request Cache on the Consumer. Resource imposition.
  • Assumes that it knows best regarding how you would like to invoke the service from a serial/parallel perspective
  • Makes resource decisions for you regarding threads etc
  • Provides defaults that it thinks are best without making you even think of your SLAs

Logic Creep into the Client

I have seen this happen a few times where business logic creeps into the binary client. This is just bad design that really negates the benefits of the services architecture. Sometimes the logic is around things like fall backs, counters, request caching etc. While these make sense to abstract away from a DRY perspective, they introduce a coupling or dependency on the client from the consumer's perspective that making changes might could require all consumers having to update. There are some clients that have 'modes' of operation and logic around what will be done in a given mode. These can be painful if they needed to change.

Resource Usage

The library provides a Request Cache to cache request data. It will use threads, memory, connection pools and many other resources while performing its job. The Service consumer might not need a multi-threaded connection pool, it might only need to obtain Notes every once in a while and does not even need to keep the connection alive. The Service consumer might not even care about paralleling calls to obtain data, it might be fine with serial. The consumer is however automatically opted-in to these invading resource usages.

Black Box

The Service Client is not something the Service Consumer wrote. On one hand service consumers care grateful that they have a library that takes away the effort around remote communication  but on the other hand, they have absolutely no control over what the library is doing. When something goes wrong, the consumer team needs to start debugging the Service Client logic and  other details, something they never owned or have in depth knowledge about. Phew!

Overloaded Responsibility

The Service owners perspective is really to generate a service that fulfills the business purpose. Their job is not to provide clients for the multitude of consumers that might want to talk to them. Writing client code to provide resiliency, monitoring and logging on communicating with the service just does not appear to be the responsibility for the service owner.

Hydra Client and Stack Invasion


Consider the following figure for this discussion:
A service client often brings along with it dependencies on libraries that the service maintainers have chosen for their stack. A consumer of the Service client are often forced to deal with managing out dependencies that would probably have never wanted in their stack but are forced to absorb them. As an example, consider a team that is invested in Spring and using Spring MVC and RestTemplate as their stack but have to suffer dependency management hell because they need to interface with a team whose Service Client is written using Jersey and need to deal with dependencies that might not be compatible. Multiply this with other Service Clients and the dependencies they bring in or go ahead and run with a Jersey 1 and Jersey 2 Client dependent libraries in your classpath to experience first hand how it would feel :-).

Heterogeneity and Polyglot Clients


"First you lose true technology heterogeneity. The library typically has to be in the same language, or at the very least run the same platform" - Sam Newman

Expecting the team generating a service to have to maintain service clients for different languages and platforms is a maintenance hell and simply not scalable. If they do not provide a client, then the ability to support a polyglot environment is stifled. When service clients start having business logic in them, it becomes really hard for service consumers not using the service team provided client to generate their own due to the complexity of logic involved. This can be a serious problem as it curbs innovation and technological advances.

Strong Coupling


The Service Client when done wrong can lead to a strong coupling between the service and its consumer. This coupling would mean that making even the smallest of changes to the service would involve significant upgrade effort from the consumers. What this does is stymie innovation on the service and taxes the service consumers into some upgrade cycle advocated by the service providers.

Benefits of the Service Client


The primary benefits that Service clients provide is DRY (Don't repeat yourself). A team that develops a service might quite well develop a client to test their service.  They might also provide integration tests with multiple versions of binary clients to ensure backward compatibility of their APIs. Their responsibility though ends there really, they really should have no obligation to distribute this client to others but the question we find a service consumer asking is; If this client is already created by the service owners and is available for free, why should I need to build one?

Remember that the Service creators are knowledgeable around the expected SLA of their service end points and the client they provide has meaningful defaults and optimizations for the same. A Service owner might augment the client library with things like Circuit Breakers, Bulkheading, Metrics, Caching and Defaults that will make the Client work really well with the service.

If a companies stack is very opinionated, for example, a non polyglot java and Spring Boot stack where every team uses RestTemplate for HTTP invocation with some discipline around approved versions of third party jars considering backward compatibility etc, then this model could very well hum along.

Client Generation


To facilitate the choice for service consumers to generate their own client, an IDL needs to be made available.  Tools like Swagger Code Gen and GRPC gen are great examples where these could be made available.  The auto-generated clients are good but as a word of caution, they aren't always optimized for high load and/or might need customization for sending custom company specific data anyways, diminishing their value as generated clients. Examples of company specific data might be things like custom trace identifiers, security info etc etc. Generated client code also will not have Circuit Breaking, Bulkheading and Monitoring features available on it effectively requiring each service consumer to write their own and with the tools available for them.

Parting Thoughts and Resources


We want to promote a loosely coupled architecture with distributed systems, i.e., between services and their consumers. This enables changes on the service to evolve without impacting consumers. A Service itself must NOT be platform/language biased and support a polyglot consumer ecosystem.

If Service owners were to design their services with the mentality that they have no control around the stack of the consumer apart from a transport protocol, it promotes better design of the service where logic does not creep into the client.

Service Clients, if created by Service owners must be 'thin' libraries devoid of any business logic that can safely be absorbed by consumers. If the client libraries are doing too much, you ought to re-think your service responsibilities and if needed consider introducing an intermediary service. I would also recommend that if a Service client is created for consumption by consumers, then limit the third party dependencies used by the client to prevent the Hydra Client effect.

It is also important to note that if a Services team creates a Client, that they do not force the consumers to use it. If the choice to use a different stack exists, then the Consumer is empowered to use the client generated by the Service maintainer or develop one independently. To a great degree service consumer teams maintaining their own clients keeps the service maintainers in check regarding compatibility and prevents logic creeping into client tier.
  • Ben Christiansen  has a great presentation on the Distributed Monolith that is must see for anyone interested in this subject. 
  • Read the Microservices book by Sam Newman. Pretty good data!
Keep following these postings as we walk into the next generation of services and tools to enable them!

If you have thoughts for or against Service Clients, please do share in the comments.